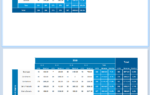
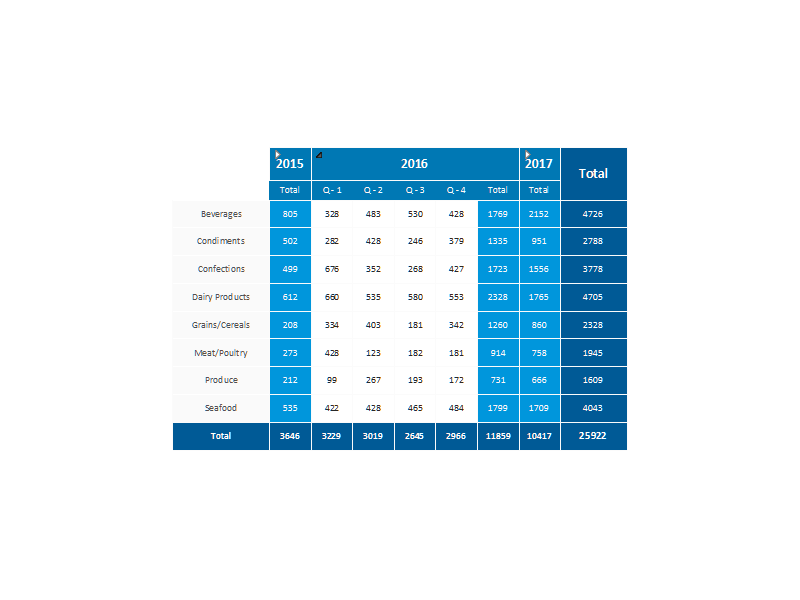
Take the following crosstab for an example:
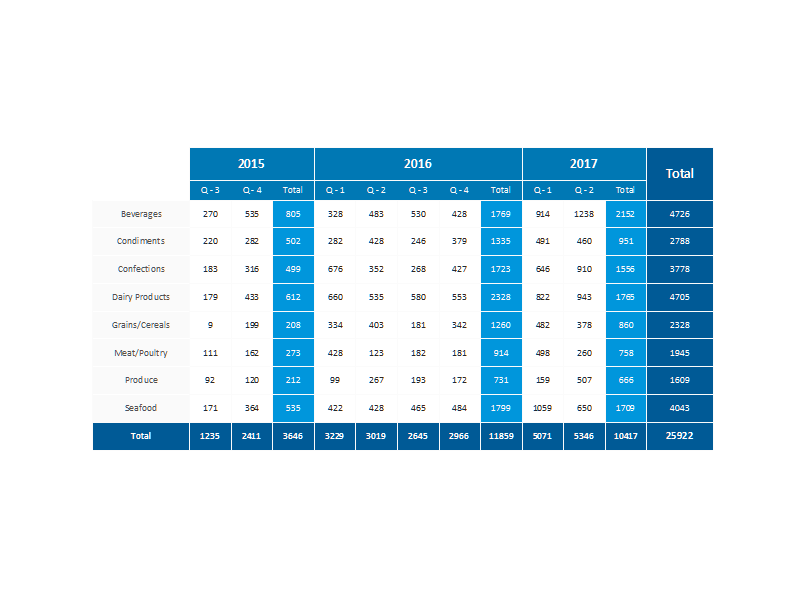
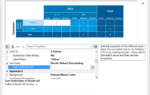
For brevity reasons, I’ve restricted it to fit on one page. However if I had activated the automatic fill-up feature it surely wouldn’t fit. Wouldn’t it be nice to hide the details for the year first and then only expand the year you’re interested in? That would allow to add way more levels of detail to the crosstab without making compromises to the readability. And that’s exactly, what the new feature is about. In the crosstab’s properties, set the “Expandable Region” property for the “Year” field to “True”:
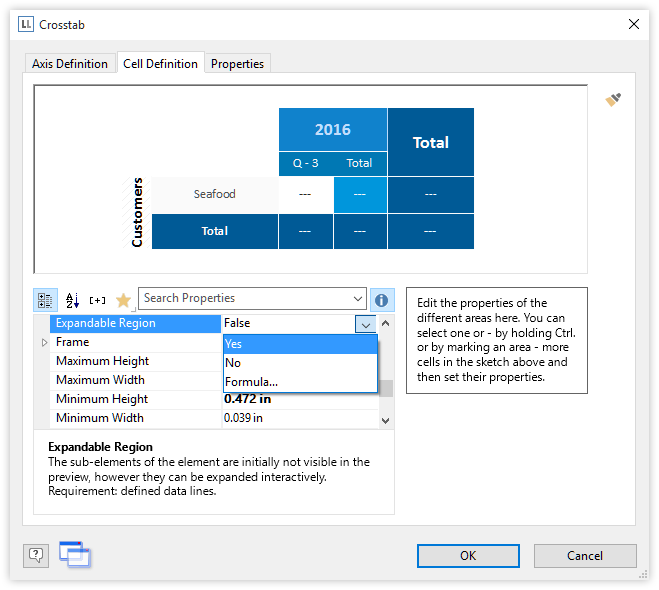
In the preview, the “Year” columns will then be rendered collapsed and a small expansion handle will appear in the cells:
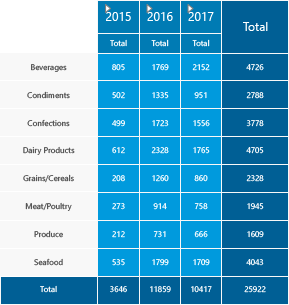
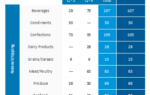
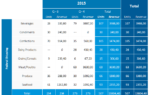
Simply click on the handle to expand the required year (and only that year):
This is a completely new and intuitive way to drill-down on your aggregated data. It allows to browse complex data at a glance in a powerful way. And it’s really fun to use, btw :).

Leading the development at combit as Managing Director. Microsoft .NET enthusiast driving innovation & agile project management. Used to be a physicist in my first life. I love hiking and vanlife.